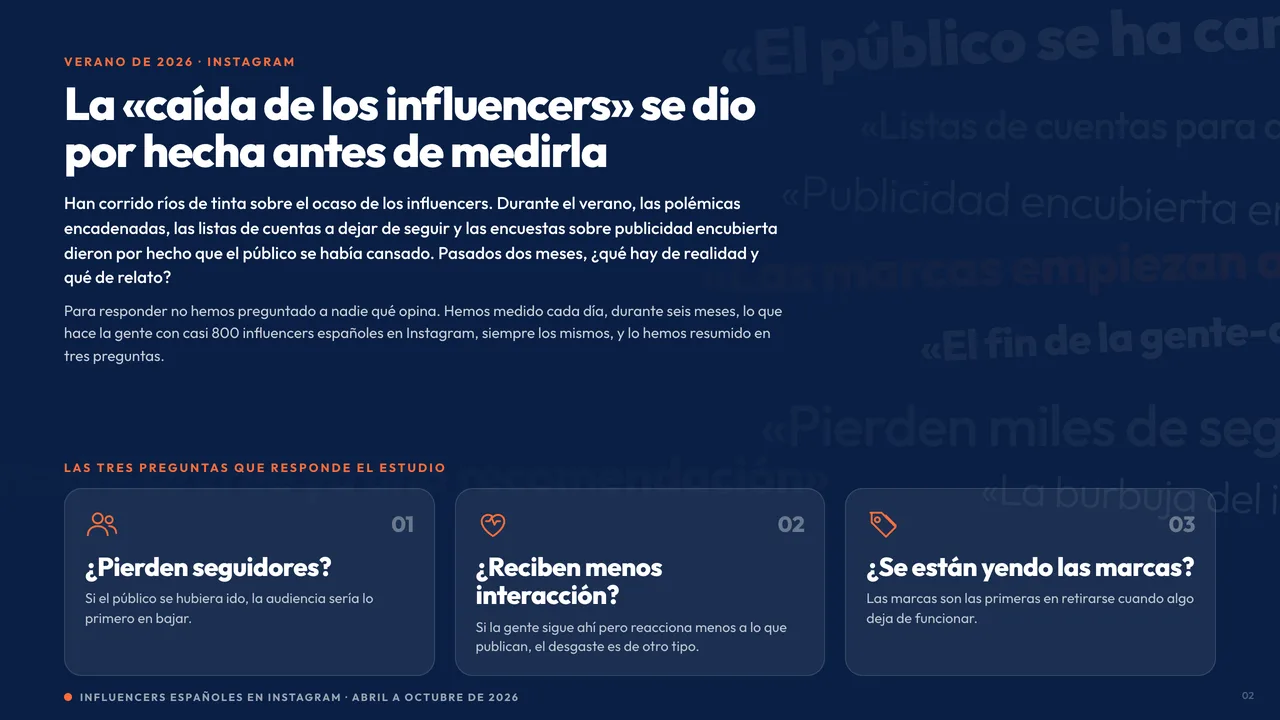
Over the summer of 2026 it was taken for granted that the public had grown tired of influencers. A string of controversies, lists of accounts to unfollow and surveys on undisclosed advertising built a story of decline that was rarely backed by any measurement.
At Science 4 Insights we wanted to test it with behavioural data rather than opinion. Since April we have tracked almost 800 Spanish influencers on Instagram every day, always the same accounts, recording their followers, the engagement each post receives and the brands that appear in what they publish. With six months of data, from April to October, the study answers three questions: whether they are losing followers, whether they are receiving less engagement and whether brands are leaving.
Key findings
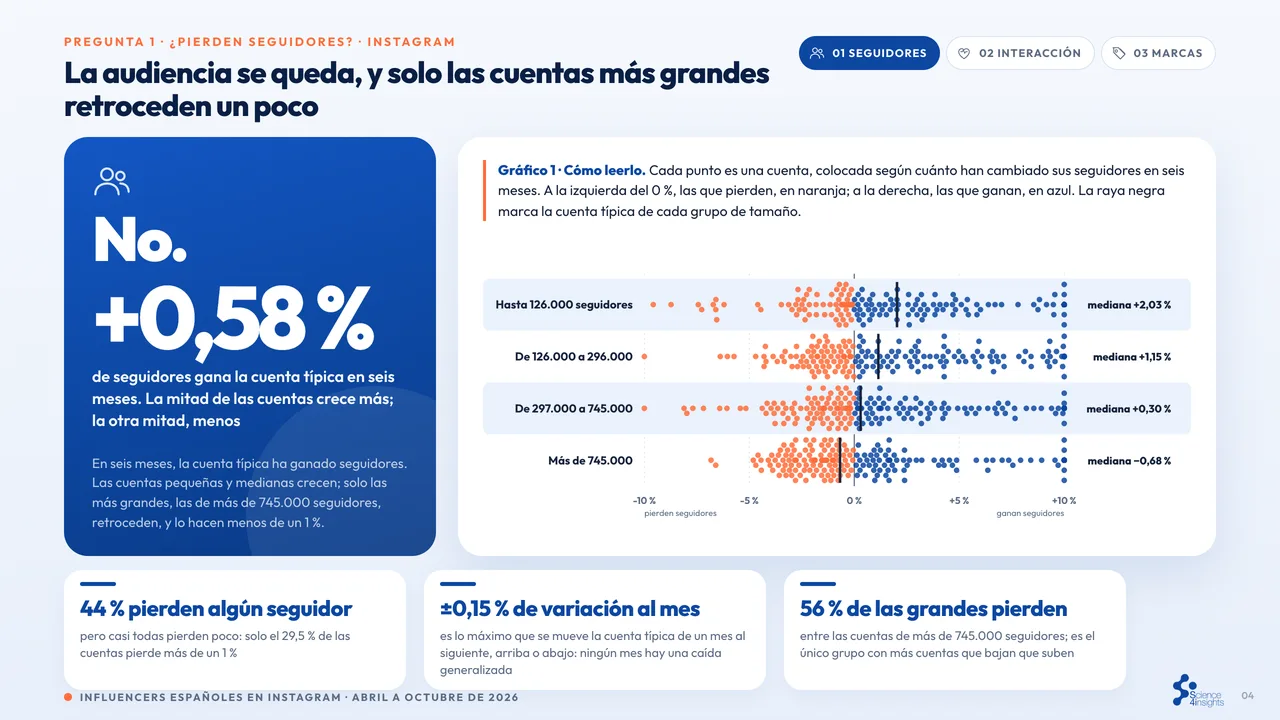
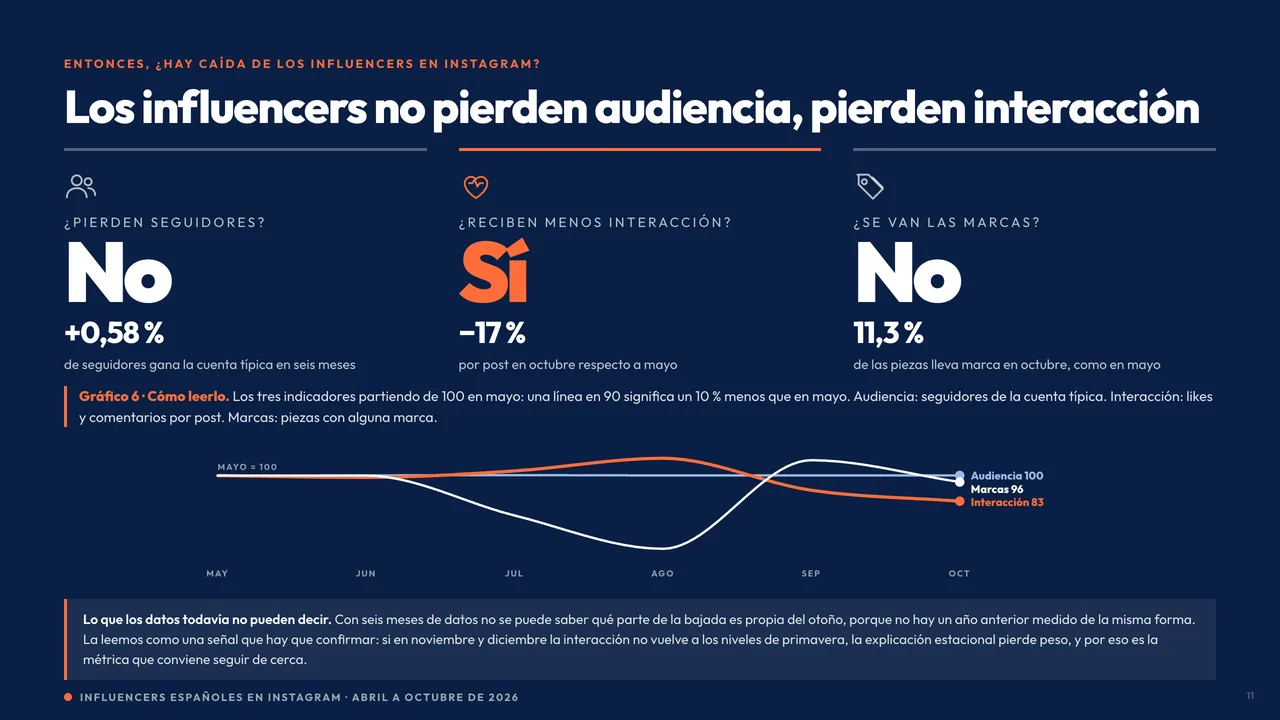
- The audience has not gone away. The typical account gains 0.58% in followers over six months, and only accounts with more than 745,000 followers fall back, by less than 1%.
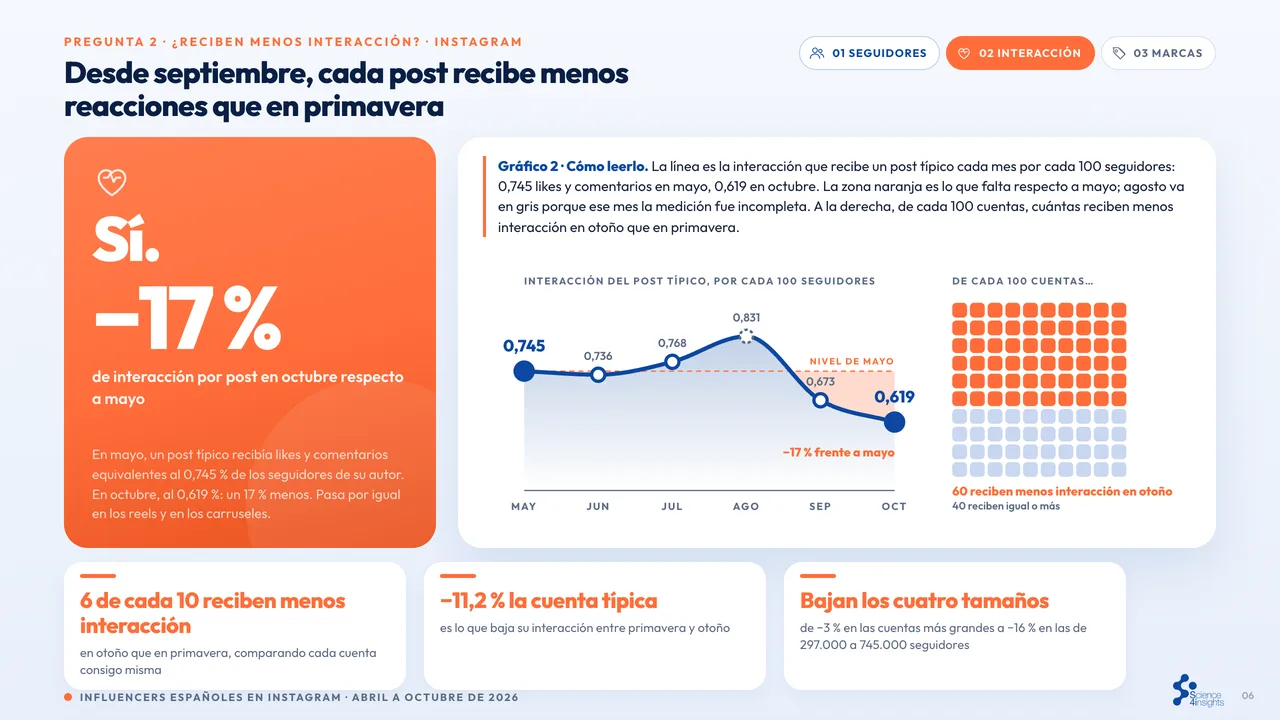
- Engagement is falling. In October each post receives 17% fewer likes and comments per follower than in May, and 6 in 10 accounts receive less engagement in autumn than in spring.
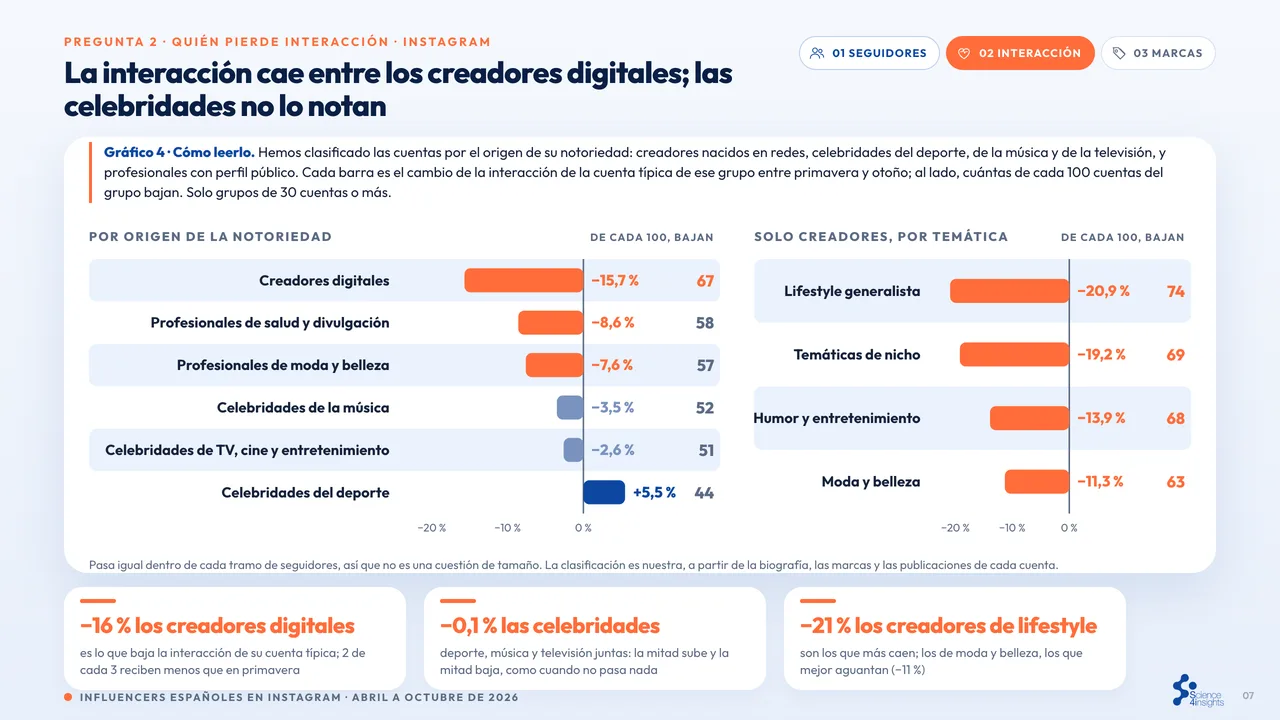
- The fall is among digital creators. Their engagement drops by 16%, while that of sports, music and television celebrities holds steady.
- Brands are staying, but rotating. In October 11.3% of the pieces published feature a brand, compared with 11.8% in May, although only 4 of the 10 brands with the most presence in spring remain in the top ten in autumn.
Are they losing followers?
No. The typical account in the panel ends the period with 0.58% more followers than in April. Small and mid-sized accounts grow, and only the group of the largest accounts closes in negative territory (−0.68%), with 56% of its accounts losing followers.
44% of accounts lose some followers, but almost always only a few: just 29.5% lose more than 1%. From one month to the next, the typical account moves no more than 0.15% up or down, so at no point in the period is there a widespread loss of audience.
Are they receiving less engagement?
Yes, since September. Engagement is measured as the likes and comments each post receives in its first 72 hours, per 100 followers of its author. In May a typical post received the equivalent of 0.745% of the author's followers; in October, 0.619%. The fall affects reels and carousels alike and appears in all four account sizes, from 3% among the largest to 16% among accounts with 297,000 to 745,000 followers.
To see who is feeling it, we classified accounts by the origin of their fame. The fall is concentrated among creators who rose to prominence on social media: their engagement drops by 16% and two in three receive less than in spring. Among sports, music and television celebrities the change is −0.1%, with as many accounts rising as falling. Among creators, lifestyle accounts fall the most (−21%) and fashion and beauty accounts hold up best (−11%). The difference also appears when comparing accounts of similar size, so it is not a matter of follower numbers.
Are brands leaving?
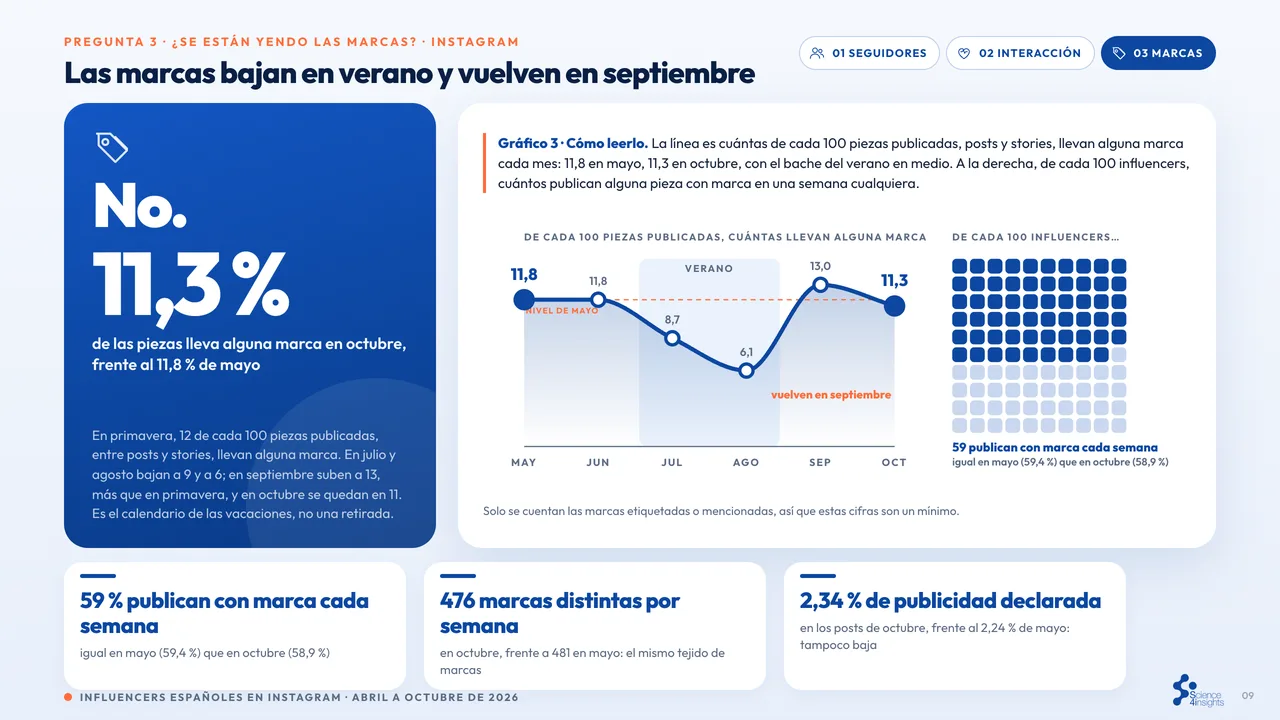
No. Brand presence follows the holiday calendar. The share of pieces featuring a brand falls in July (8.7%) and August (6.1%), rises in September to 13.0%, above spring levels, and stands at 11.3% in October. 59% of influencers publish at least one piece featuring a brand every week, the same in May as in October, and the number of different brands per week barely changes (481 in May and 476 in October).
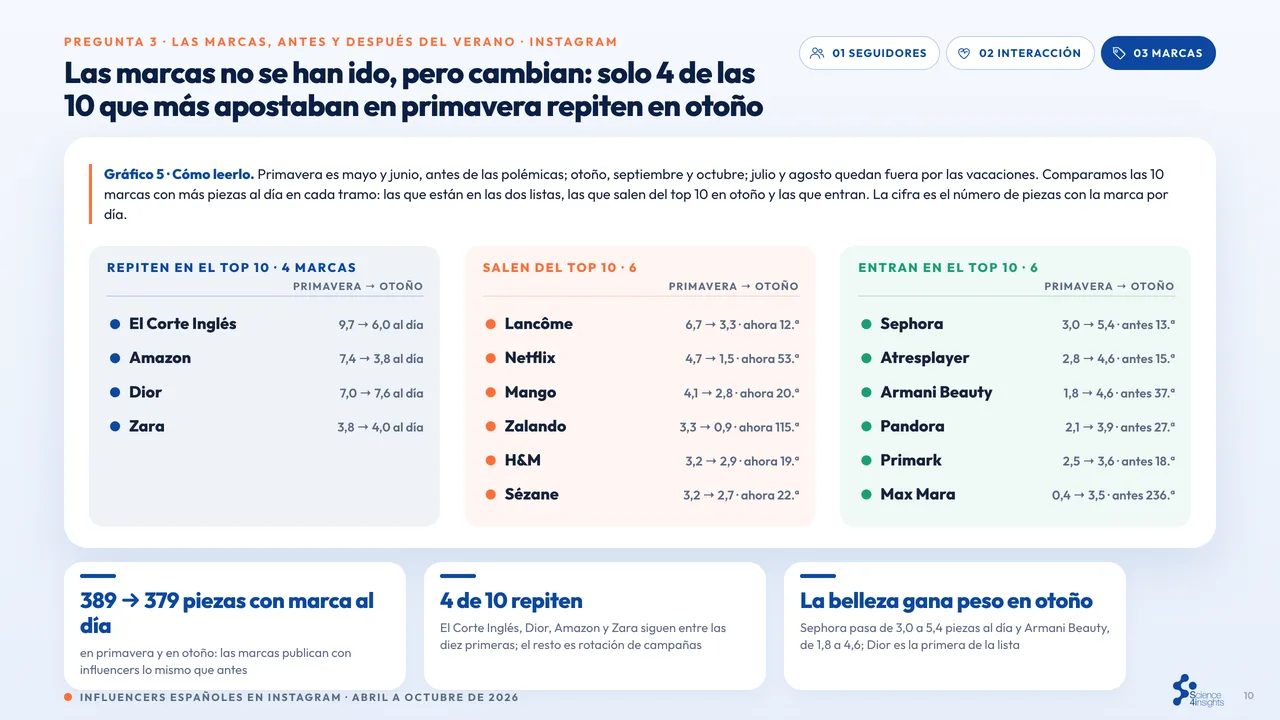
What changes is who is there. Between May–June and September–October almost the same number of brand pieces are published per day (389 and 379), but only El Corte Inglés, Dior, Amazon and Zara remain in the top ten in both periods. In autumn beauty gains ground: Sephora rises from 3.0 to 5.4 pieces a day, Armani Beauty from 1.8 to 4.6, and Dior tops the list.
A signal worth following
The “fall of the influencers” does not show up in audience figures or in brand presence; it shows up in engagement, and above all in the engagement of digital creators. With six months of data it is not possible to separate how much of that fall is seasonal, because there is no previous year measured in the same way. If engagement does not return to spring levels in November and December, the seasonal explanation will lose weight. That is why it is the metric we will be watching most closely.
The full study
The study includes the charts for each answer, the breakdown by account size and type, the brands entering and leaving the top 10 and the methodological note. Its pages can be browsed below, and the PDF, in Spanish, can be downloaded at the end of this post.
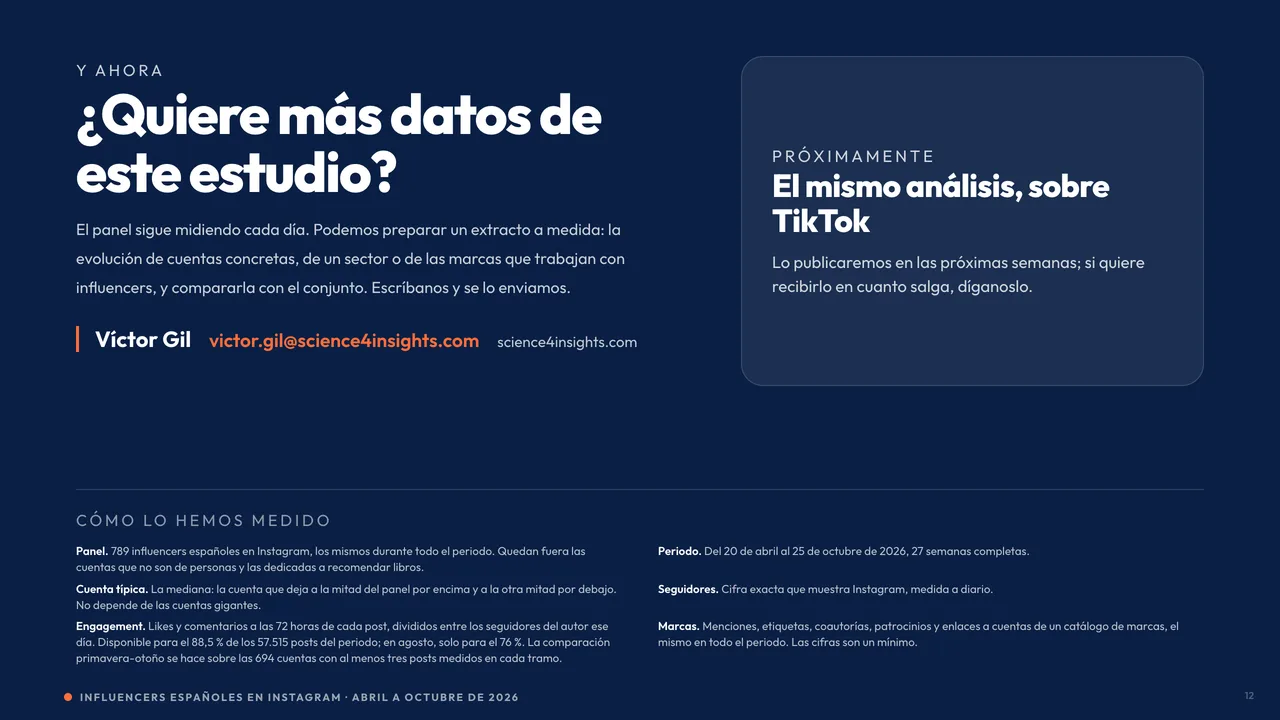
How we measured it. A fixed panel of 789 Spanish influencers on Instagram, tracked daily from 20 April to 25 October 2026. Followers are the exact figure Instagram shows each day. Engagement is calculated 72 hours after each post. Brands are detected through mentions, tags, collaborations and links to accounts in a fixed catalogue, so the brand figures are a minimum.
The panel continues to measure every day. We prepare tailored extracts showing the evolution of specific accounts, of a sector or of the brands that work with influencers, compared with the panel as a whole. They can be requested by writing to victor.gil@science4insights.com. In the coming weeks we will publish the same analysis for TikTok.